Total Transportation System Solutions (T2S2)
1739 McPherson St
Port Huron, MI 48060
ph: 810-858-2640
michael
Spatial Analysis of Signalized Intersections Sampled for Possible Removal in the City of Detroit
Michael H. Schrader, PE
Wayne State University
April 2014
Introduction
Since 1950, the City of Detroit's population has decreased by over 1,000,000, representing a 61 percent loss of its peak population. Due to this dramatic population loss, much of the city is underpopulated, yet the city must maintain the infrastructure it had at its peak, with a much smaller tax base to do it with. Thus, it is imperative for the city to find ways to reduce its infrastructure maintenance requirements. One such way is by reducing the total number of traffic signals, thereby saving operation and maintenance costs. A study has been underway to analyze the existing signal infrastructure and make recommendations as to how to save operating and maintenance costs.
The first phase of this study entailed conducting an inventory. The second phase involved sampling these locations and determining at how many of the sampled locations the signal could be replaced by either a two-way stop or an all-way stop. The third phase is extrapolating those results to the city as a whole. Of the 1510 signals inventoried, 100 were sampled, and 49 were determined to be removable. However, before extrapolating these percentages, it is important to perform a spatial analysis of the locations to determine if the sample was truly geographically random, and if there are any correlations between the type of treatment and land uses. The purpose of this analysis was to determine the geographic randomness of the sample and if any relationship exists between the type of recommended treatment and land use. Specifically, this analysis was intended to answer three questions:
Question 1- Was the sample geographically dispersed throughout the city?
When taking a random sample, it is important that the sample be random. Each intersection was given a unique identifier, and these unique identifiers were drawn out of hat. Once an identifier was selected, it was removed from the pool of available selections; so, as the process transpired, the pool of available selections continuously decreased, increasing the probability that an intersection that had not been selected will be selected. This was done to increase the odds that a particular intersection that had not been selected will be selected. This also increased the odds that a particular geographic would not be selected more than others. If the spatial analysis revealed a predominance of the locations feel in the same geographic area, that would indicate that the random number generator did not do so, and the analysis would need to be redone.
Hypothesis 1: The sampled intersections are geographically diverse.
The second reason for a spatial analysis is to determine if the outcomes, namely the three possible intersection treatments (keep the signals, replace with an ALL WAY stop, replace with minor street stopping only), are geographically dependent. In other words, will all possible outcomes of a particular type be located in a discreet geographic area? If there is a geographic dependency, then that geographic bias will have to be ascertained and calculated in order to be able to properly evaluate the operation of the intersections.
Question 2: Are the outcomes geographically dispersed?
Assuming that Q2 is answered positively, there is one more important factor that should be analyzed for a relationship with the three possible outcomes – land use. For the sake of discussion, say that the intersections are scattered throughout the city, and not only are the intersections scatters, so too are the outcomes. Even if that is so, the outcomes can still correlate to land uses, with particular land uses yielding particular results, unique to that land use. Such a correlation could help transportation professionals more accurately identify signal locations to study for removal. Thus, it is important to know if a relationship exists between the outcome and the land use.
Question 3: Does the land use affect the outcome? If the land use is known, can the outcome be predicted?
The focus of this spatial analysis is to answer these three questions.
Methodology
As stated previously, there were three possible outcomes to the signal removal feasibility analysis of the signalized intersections studied- (1) the signals have to stay(coded “signals”); (2) the signals can be replaced by an all-way stop (“ALL-WAY”); (3) the signals can be replaced with stop signs on one street only, allowing for uninterrupted flow on the other. (“2-Way”). Also as sated, each intersection was assigned a unique identifier, and identifiers were chosen at random from a hat. These sampled intersections were then analyzed to determine if signals could be removed, and if so, which type of stop condition to replace them with. To determine an answer to the questions proffered, these locations were plotted on a map along with existing land uses. With one exception, the land uses were determined by reviewing satellite photos on line, with subjective determinations of each land use being made. Since the same researcher viewed all the satellite data and made land use determinations for the entire city, there is no relative researcher bias. The land uses were categorized as follows: commercial, government, industrial, midtown, open, park, and residential. The commercial land use is one that involves the sales of goods or production of services. Private colleges would fall into this category, as well as hospitals, professional offices, etc. The government land use is for government functions that are necessary for its operation, most notably military installations. It also includes state universities, as state universities are not subject to local zoning and planning control like private ones. Industrial is the production or warehousing of good; industrial uses typically have high heavy vehicle traffic for the delivery of goods, and often are located adjacent to airports or railroads for the efficient delivery of raw materials. The midtown land use is the exception, as midtown is a defined geographic area. Because a previous signal study has already been completed for this area, this area, and its signalized intersections, have been excluded from the study. Open land is land that is no longer being used for what it was intended and have been, or is in the process of being abandoned. Vacant lots are a indication of open land; so too are derelict buildings. Parks are parks or other open spaces accessible to the public that are maintained and were intended to be an open space. Cemeteries were included in the park designation. Finally, residential areas are those whose primary use and purpose is to be a domicile. Residential areas include both single family and multifamily, and also include isolated small commercial establishments that primarily serve the surrounding neighborhood.
The analysis
The map showing the land uses and the sampled intersections is shown in Figure 1.
FIGURE 1. Map of signal locations and land use
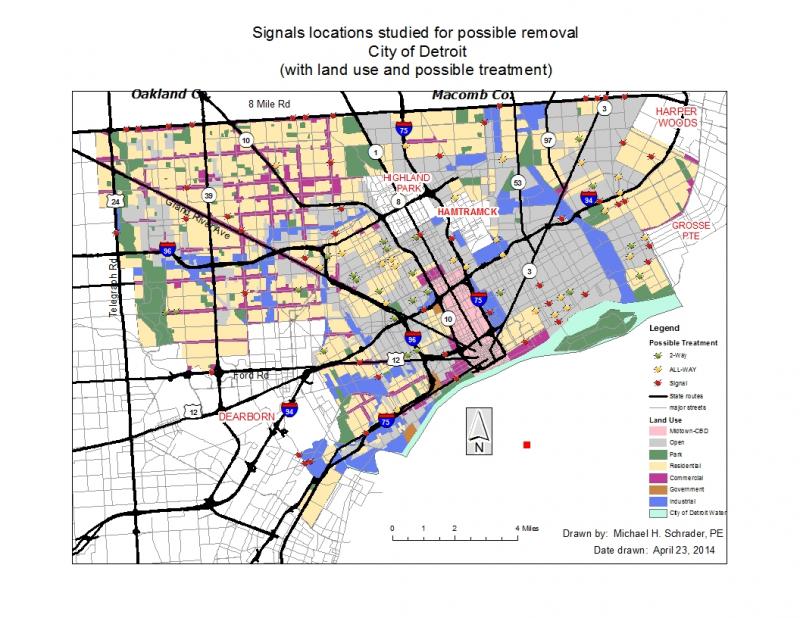
Some interesting observations should be made from the figure regarding land use, and specifically the abandoned zones (shown in gray). By far, the two most predominant land uses in the city of Detroit are residential and abandoned (open). A count analysis of the land use indicates that residential is 40 percent of the total land available in Detroit, and the abandoned areas are 32 percent. Midtown, which contains 15 percent of the total signal population, comprises less than 3 percent of the total land area. The residential areas are isolated from each other, necessitating traveling through either industrial areas or the “dead” zones to get from one to another; instead of one Detroit, there are many mini-Detroits. The pattern of the “dead” zones is interesting, as there is a central core dead zone and radial zones that follow the radial routes. It would be interesting to determine if the dead zones continue beyond the city limits, how far beyond they extend, and if they follow the same pattern.
As can be seen from the figure, the sample sites are dispersed throughout the city; thus, Question 1 is answered affirmative and Hypothesis 1 is true. Question 2 is also true, as the three different outcomes can be found throughout the city. Looking at the figure, Question 3 appears to be false, as all three outcomes are found in a variety of land use areas. In other words a particular outcome is not unique or more common to a particular use; thus it would be difficult, and imprudent, to determine signal locations to study for removal based solely on land use.
Conclusions
This was a very simple analysis to determine the randomness of a particular random number generator, in this case, a hat, and to determine if there was an obvious correlation between the type of outcome and geography, as well as one between the type of outcome and a particular land use. This analysis showed that picking numbers out of a hat is an effective random number generator, as the intersections selected were distributed throughout the entire city as both intended and desired. Surprisingly, there does not appear to be a link between geographic location or neighborhood in the city and the type of outcome, as there have been theories of such a connection. Even more surprising is the lack of a connection between land use and outcome. One could logically assume that the “dead” zones would have the least amount of traffic and signalized intersections in these zones could be unsignalized. However, since the outcome of some of the locations studied in the “dead” zones resulted in a need to keep the signals, there is obviously some other contributory factor.
This simple analysis is the foundation for much more elaborate studies in the future. First and foremost, the “dead” zones. Are they unique to Detroit? Do they extend into the suburbs? Do other urban areas have similar “dead” zone patterns? Second, contributory factors for trip generation. If geography and land use don't have an obvious role, then what does? Is trip generation a product of many different influences, of which land use and geography may only be a small part? To make more accurate models, it behooves us to understand all the factors that contribute.
SOURCES
Street, city limit, and geographic information about the city of Detroit obtained through Wayne State University.
Signal analysis performed by Michael H. Schrader, PE, using the Highway Capacity Software, 2010.
Land use information obtained from satellite images from Google and Apple iPhone Map app.
1739 McPherson St
Port Huron, MI 48060
ph: 810-858-2640
michael